Community Life
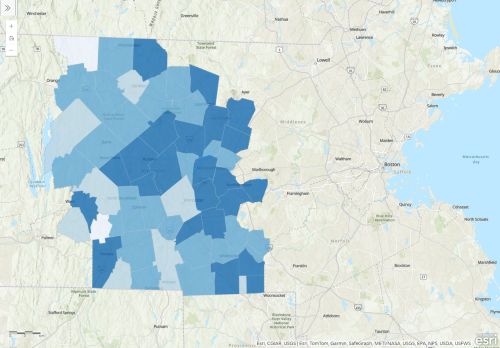
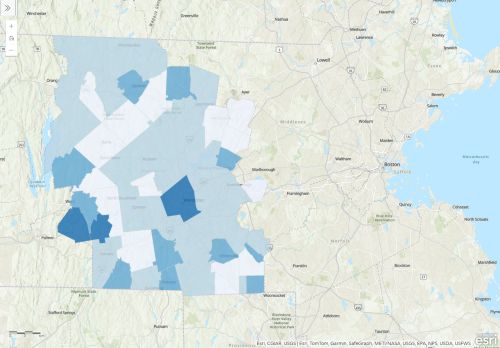
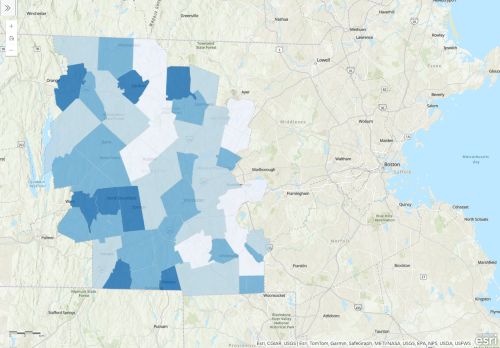
Households With Internet Access
The percentage of households that have access to the internet.
VIEW MAP
The percentage of households that have access to the internet.
VIEW MAP
Demographics and Diversity
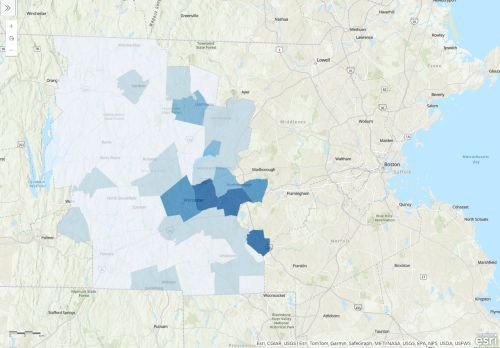
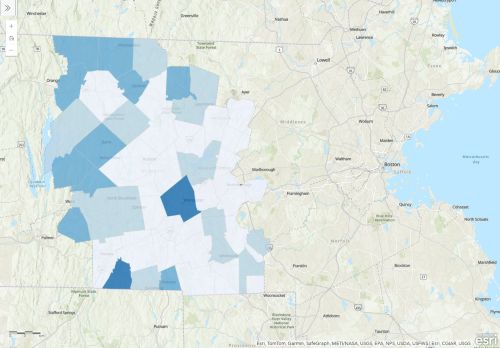
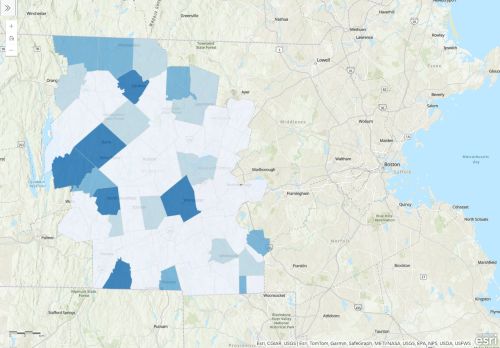
Foreign-Born Population
The percentage of the population in a region that is foreign-born, which includes anyone who is not a U.S. citizen at birth. People who become U.S. citizens through naturalization are considered foreign-born.
VIEW MAP
The percentage of the population in a region that is foreign-born, which includes anyone who is not a U.S. citizen at birth. People who become U.S. citizens through naturalization are considered foreign-born.
VIEW MAP
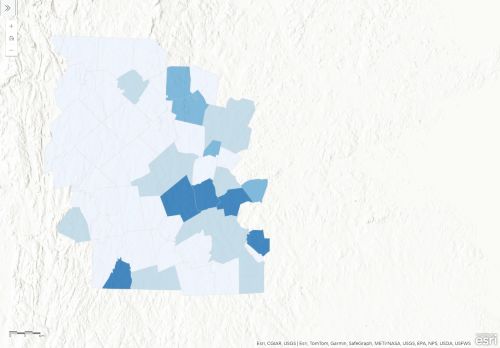
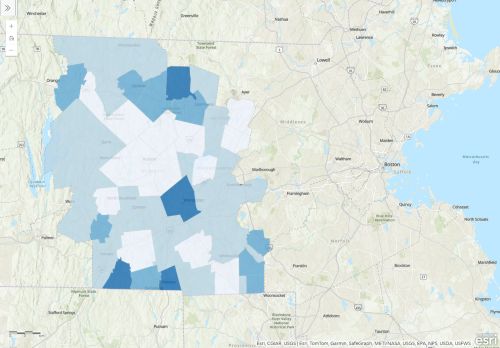
Language Diversity
The share of people age five and older in a geographic area who speak a language other than English at home. This includes both people who speak English well and those who do not.
VIEW MAP
The share of people age five and older in a geographic area who speak a language other than English at home. This includes both people who speak English well and those who do not.
VIEW MAP
Economic Mobility
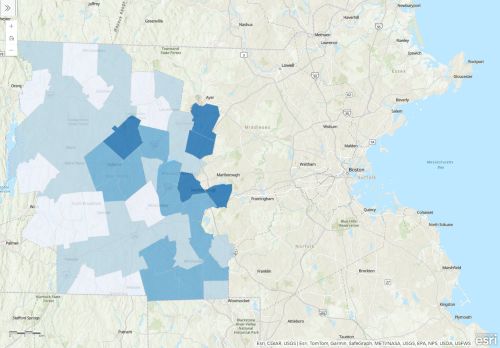
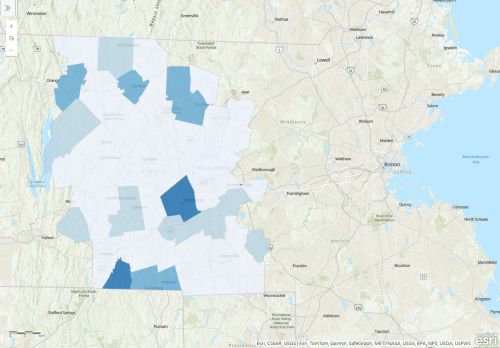
Median Household Income
Median household income, in 2022 dollars. Half of incomes are below the median and half are above.
VIEW MAP
Median household income, in 2022 dollars. Half of incomes are below the median and half are above.
VIEW MAP
80/20 Income Ratio
The 80/20 ratio describes the disparity in the size of the income of a household at the 80th percentile relative to that of the income of a household at the 20th percentile. A higher ratio indicates greater income inequality.
VIEW MAP
The 80/20 ratio describes the disparity in the size of the income of a household at the 80th percentile relative to that of the income of a household at the 20th percentile. A higher ratio indicates greater income inequality.
VIEW MAP
People Living in Poverty
People with incomes below the poverty line, as a percentage of those for whom poverty status has been determined. Poverty thresholds vary by family composition and year. In 2022, the threshold for a four-person family with two children was $29,700.
VIEW MAP
People with incomes below the poverty line, as a percentage of those for whom poverty status has been determined. Poverty thresholds vary by family composition and year. In 2022, the threshold for a four-person family with two children was $29,700.
VIEW MAP
Overall Housing Cost Burden
The share of housing units with people paying 30% or more of their income in rent or ownership costs.
VIEW MAP
The share of housing units with people paying 30% or more of their income in rent or ownership costs.
VIEW MAP
Households Without Vehicles
The number of households which do not report having a vehicle kept at the home, available for use, expressed as a percentage of all households.
VIEW MAP
The number of households which do not report having a vehicle kept at the home, available for use, expressed as a percentage of all households.
VIEW MAP
Health and Wellbeing
People with Disabilities
The percentage of the people living with a disability, out of all people not living in institutions.
VIEW MAP
The percentage of the people living with a disability, out of all people not living in institutions.
VIEW MAP
Youth and Education
Children Living in Poverty
The number of children under 18 living below the federally defined poverty line, expressed as a percentage of all children under 18. Poverty thresholds vary by family composition and year. In 2022, the threshold for a four-person family with two children was $29,700.
VIEW MAP
The number of children under 18 living below the federally defined poverty line, expressed as a percentage of all children under 18. Poverty thresholds vary by family composition and year. In 2022, the threshold for a four-person family with two children was $29,700.
VIEW MAP
